Related Articles
Key Takeaways
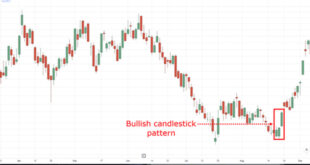
Bearish candlestick patterns are crucial tools for traders, as they help signal when a market might reverse from an uptrend to a downtrend. Recognizing these patterns early can give traders a chance to adjust their positions and manage risk effectively.
Patterns such as Bearish Engulfing, Evening Star, and Dark Cloud Cover are powerful indicators of potential market downturns. These patterns alert traders to possible changes in market direction, offering them the chance to take action before significant losses.
To use these patterns successfully, traders should combine them with other technical indicators, practice good risk management, and consider the overall market conditions. This approach reduces the chances of acting on false signals and enhances the effectiveness of their trading strategies.
In this article, we’ll explore 21 key bearish candlestick patterns every trader should know in 2025!
| Pattern | Description | Image |
|---|---|---|
| Bearish Engulfing | A larger, darker candlestick engulfs a smaller, lighter one, signaling a strong reversal to the downside. | 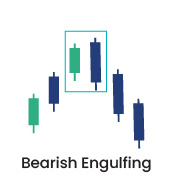 |
| Evening Star | A small candlestick appears after a rally, followed by a dark candlestick, marking a shift from hope to despair. |  |
| Dark Cloud Cover | A bright candlestick is swallowed by a dark one, warning of a bearish shift and signaling the coming storm. |  |
| Shooting Star | A high candlestick with a long upper shadow rises quickly but falls back down, signaling the end of an uptrend. | 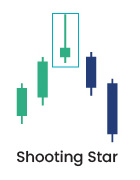 |
| Hanging Man | A candlestick with a long lower shadow forms at the top of an uptrend, suggesting that bulls may be losing control. | 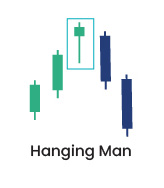 |
| Three Black Crows | Three consecutive dark candles, each stronger than the previous, signal a steady decline in price after an uptrend. |  |
| Bearish Harami | A small dark candle is trapped within a larger white candle, indicating uncertainty and a potential trend reversal. |  |
| Bearish Doji Star | A small Doji between two long candles signals indecision and a potential reversal of an uptrend. |  |
| Gravestone Doji | The market rises but then falls back, leaving a long upper shadow, signaling a loss of bullish momentum. |  |
| Bearish Abandoned Baby | A rare pattern where a gap between three candles signals a sharp reversal after an uptrend, leaving the previous bullish trend behind. | 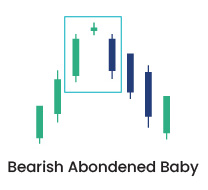 |
| Tweezer Tops | Two candles with the same high appear at the top of an uptrend, signaling a potential bearish turn. | 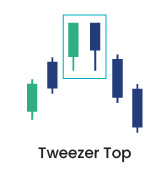 |
| Bearish Belt Hold | A solitary dark candle forms at the top of an uptrend, suggesting that the bulls no longer have control. | 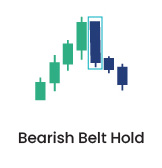 |
| Bearish Kicker | A sudden shift in trend as a long dark candle “kicks” the previous one away, indicating a sharp reversal. |  |
| Three Inside Down | Three candlesticks appear after a bullish trend, signaling the quiet death of the uptrend as bears take control. | 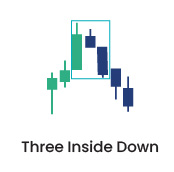 |
| Three Outside Down | A stronger reversal signal than Three Inside Down, with a dark candlestick engulfing a smaller one, signaling a bearish shift. | 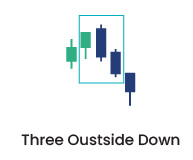 |
| Bearish Mat Hold | A brief pullback in an uptrend is followed by a dark candlestick, completing a signal that holds the price lower. | 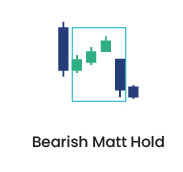 |
| Upside Gap Two Crows | A gap appears between two dark candles after an uptrend, signaling the onset of a bearish trend. | 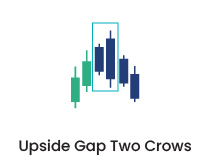 |
| Falling Three Methods | Three small candlesticks pause during a downtrend, indicating that the bears are gathering strength to push lower. | 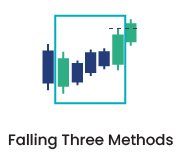 |
| Bearish Separating Lines | A dark candlestick appears after a rally, signaling the end of the bullish phase and the beginning of a bearish shift. | 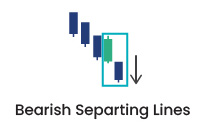 |
| Advance Block | A series of small candles at the top of an uptrend suggests that the advance is stalling and that bears are preparing to take control. | 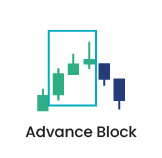 |
| Bearish Stalled Pattern | A small candle at the peak of an uptrend signals a halt, followed by a downturn, indicating a potential reversal. | 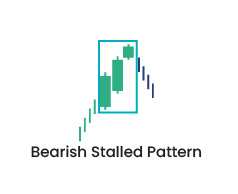 |
How to Use Bearish Candlestick Patterns in Trading

Using bearish candlestick patterns in your trading strategy can help you spot market reversals and improve your chances of making a profit. Here are some simple tips:
- Combine with Other Indicators: Use tools like moving averages, RSI, and MACD to confirm the signals from bearish candlestick patterns. This helps reduce the risk of false signals.
- Set Stop-Loss Orders: Always set stop-loss orders to protect yourself from big losses if the market goes against your trade.
- Monitor Market Conditions: Bearish patterns work better in certain market conditions. Pay attention to the overall trend and trading volume to judge how strong the pattern is.
- Practice on Demo Accounts: Before trading with real money, practice spotting and trading these patterns on demo accounts to build confidence.
Combining Bearish Patterns with Other Indicators
To make better decisions, combine bearish candlestick patterns with these indicators:
- Moving Averages: If a bearish pattern forms below a moving average (like the 50-day or 200-day), it confirms a downtrend.
- RSI (Relative Strength Index): If RSI is above 70 (overbought), a bearish pattern signals a potential sell. If RSI is below 30, the market might already be oversold.
- MACD (Moving Average Convergence Divergence): A bearish pattern combined with the MACD crossing below the signal line confirms a downtrend.
- Volume Analysis: High volume during a bearish pattern means more sellers, confirming a stronger downtrend. Low volume might mean the pattern is weak.
- Support and Resistance Levels: If a bearish pattern appears near a resistance level or breaks below support, it suggests a stronger reversal or downtrend.
By using these patterns and combining them with other tools, you can make smarter trading decisions.